
Definitions
Strokes represent a serious health concern in the United States today. A stroke occurs when the brain’s blood supply is interrupted, resulting in the death of brain tissue. This can happen in two different ways:
- Ischemic strokes, which account for 87% of all cases of stroke, occur when blood flow through the brain’s arteries is restricted due to fatty deposits on the artery wall—a condition known as atherosclerosis. These deposits can lead to stroke either by enlarging to the point that they form a blood clot and clog off the vessel, or by trapping blood clots from other parts of the body. For more information, see Let’s Talk About Ischemic Strokes (PDF). (Reference 1)
- Hemorrhagic strokes, which account for about 13% of all cases of stroke, occur when a weakened blood vessel ruptures and compresses the surrounding brain tissue. The rupture is most often due to either a brain aneurysm (ballooning of the vessel), or to abnormal vessel formations that people are born with. For more information, see Let’s Talk About Hemorrhagic Strokes (PDF). (Reference 1)
You may have also heard of Transient Ischemic Attacks (TIAs) or mini-strokes, which are brief strokes with symptoms that usually only last for a few minutes. These can be predictors of future strokes.
Reference: American Heart Association – American Stroke Association. Accessed May 2021
Signs and Symptoms
- Face drooping
- Sudden numbness or weakness in arm, leg, or face
- Speech difficulty such as slurred speech
- Sudden confusion of trouble understanding
- Sudden trouble seeing in one or both eyes
- Sudden trouble walking, dizziness, loss of balance or coordination
- Sudden severe headache with no known cause
If someone shows any of these symptoms, even if the symptoms go away, call 9-1-1 and get the person to the hospital immediately. Check the time so you know when the first symptoms appeared.
For more information, see Let’s Talk About Stroke, TIA and Warning Signs (PDF).
Reference: American Heart Association – American Stroke Association. Accessed May 2021
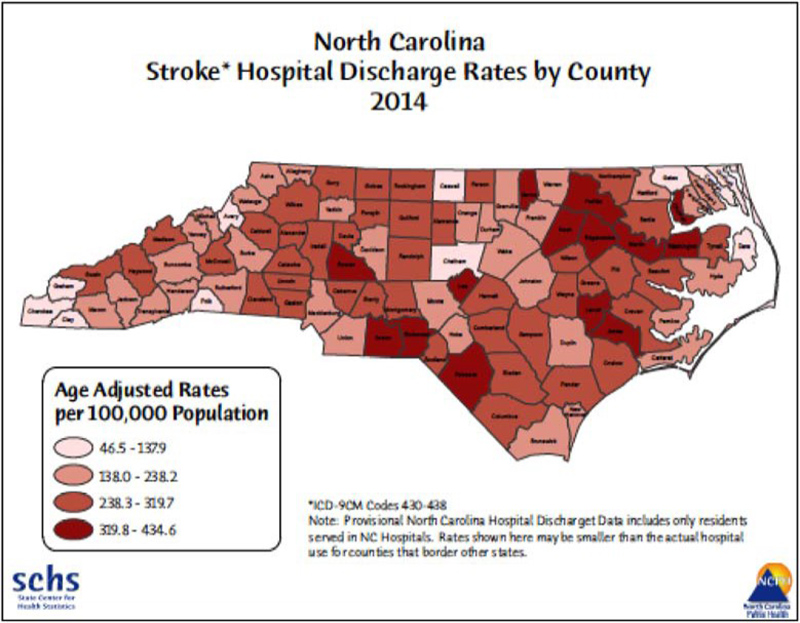
Source: North Carolina State Center for Health Statistics
Stroke Facts
Prevalence
- Each year nearly 800,000 people in the US experience a new or recurrent stroke.
- In 2016, at the start of the COMPASS study, an estimated 7 million adults were living with stroke in the US.
- By 2030, an additional 3.4 million will have a stroke.
- In North Carolina, there were 29,599 hospital admissions in 2012. That means one stroke hospitalization every 20 minutes, which resulted in $2.5 million in hospital charges for stroke each day.
- North Carolina has a particularly high stroke burden and is part of the nation’s so-called “Stroke Belt.” Eastern NC is in the “buckle” of the Stroke Belt, where stroke mortality is 40% higher than the national average and hospital readmission rates are the highest in NC.
- African Americans, over 20% of the NC population, have higher stroke incidence and worse outcomes than their white counterparts.
References
- Virani SS, Alonso A, Aparicio HJ, et al. Heart Disease and Stroke Statistics-2021 Update: A Report 1293 From the American Heart Association. Circulation. 2021;143(8):e254-e743.
- Bertoni AG, Ensley D, Goff DC. 30,000 fewer heart attacks and strokes in North Carolina: a 1299 challenge to prioritize prevention. North Carolina medical journal. 2012;73(6):449-456. 1300
- Kennedy BS. Does race predict stroke readmission? An analysis using the truncated negative 1301 binomial model. J Natl Med Assoc. 2005;97(5):699-713.
- North Carolina Department of Health and Human Services, Division of Public Health, State Center for Health Statistics. Inpatient Hospital
Mortality
- In 2018, 1 in every 6 deaths from cardiovascular disease was due to stroke
- The stroke mortality is currently on the decline: from 2001 to 2011 the number of stroke deaths fell by 21%.
- The decrease in stroke mortality is attributed in part to better blood pressure and cholesterol control, better diabetes management, and the success of anti-smoking campaigns.
References
- Centers for Disease Control and Prevention: Stats of the State of North Carolina. Accessed May 2021
- Mozaffarian D, et al. Heart Disease and Stroke Statistics—2015 Update: A Report From the American Heart Association. 2015; 131:e1- 294
Costs
- Stroke is the leading cause of serious long-term disability
- Stroke costs the United States over $45 billion per year
Reference: Centers for Disease Control and Prevention: Stroke Facts. http://www.cdc.gov/stroke/facts.htm Accessed May, 2021
Funding from the Patient-Centered Outcomes Research Institute (PCORI) Award (PCS-1403-14532). All statements are solely those of the presenters and do not necessarily represent the views of PCORI or its Board of Governors or Methodology Committee.