The second Florence Nightingale Day was recently held at Wake Forest University in Manchester Hall. The event was sponsored by the Department of Statistical Sciences at Wake Forest University, Department of Biostatistics and Data Science at Wake Forest University School of Medicine, Winston-Salem State University and Florence Nightingale Day for Statistics and Data Science. The event brought together a diverse group of 23 middle and high school students from around the Triad area of North Carolina
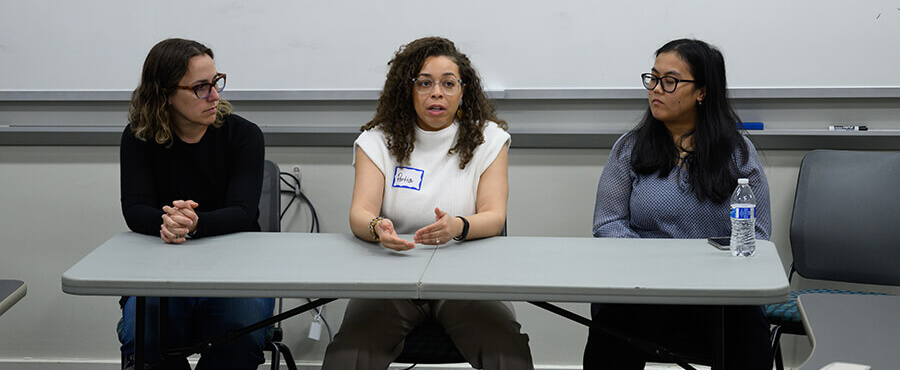
Following an icebreaker trivia game led by graduate students in the Department of Statistical Sciences, students interacted with a panel of statisticians and data scientists. The panel included Emily Griffith, PhD (North Carolina State University), Amy Zinnia, BS (Wake Forest University School of Medicine) and Portia Exum, MS (SAS). The speakers shared with students about their diverse educational backgrounds and career paths from academic faculty to software development. They also emphasized the importance of curiosity and lifelong learning as the statistics and data science field continues to rapidly evolve. Because careers in statistics can touch on areas of business, finance, sports, medicine and government, it was also discussed how it’s important to have secondary interests and areas that you enjoy. The many industries that employ statisticians and data scientists also leads to a robust job market full of opportunities for students.
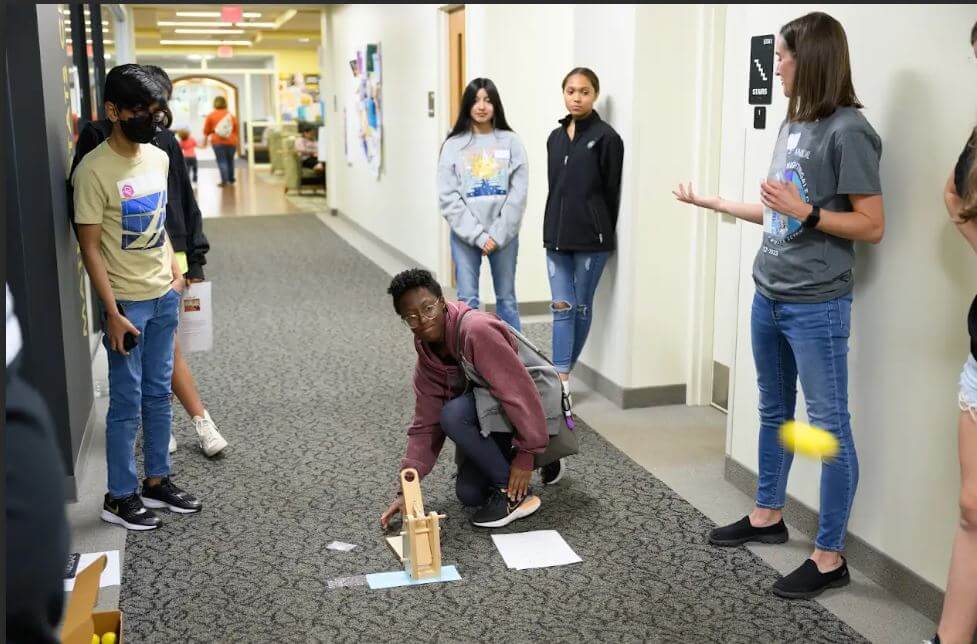
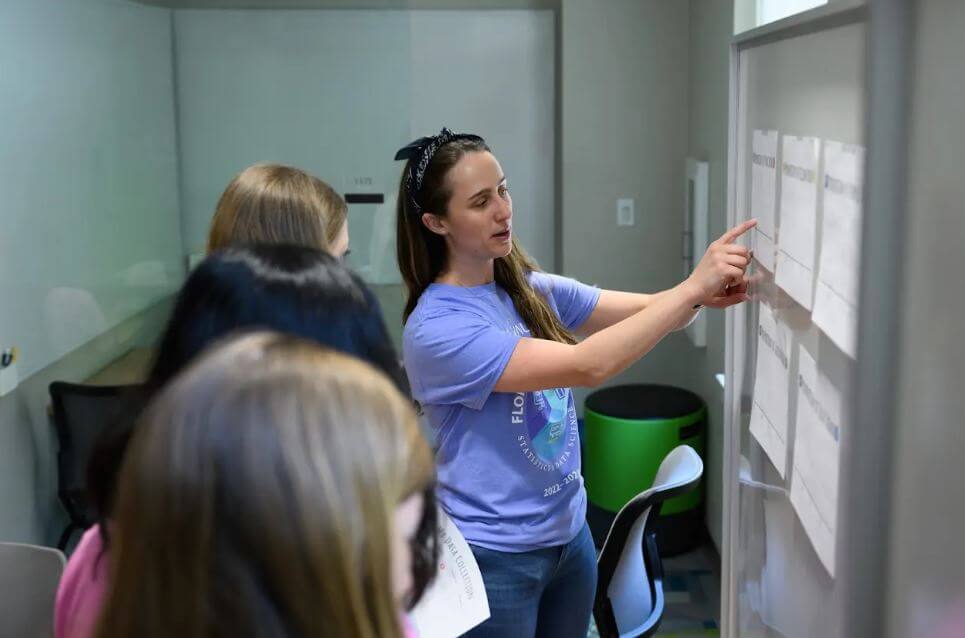
Students then had an opportunity to learn from four hands-on activity stations. In the first station, students were given a data table about album sales and were tasked with creating a visualization to communicate the information in the data set. At the end of the afternoon, winners were selected from the “data art show”. In the second station, students were tasked with determining if a lost pet was a dog or a cat based on information about the lost pet and information about other dogs and cats. This activity taught students to reason like a classifier in machine learning but on their own instead of using a computer. Students came up with many creative solutions for how to use the data to predict whether the missing pet was a dog or cat. In the third station, students used the “statapault” (catapault) to learn about principles of experimental design. They were given time to experiment and collect data to determine the best settings of the statapault for launching balls into designated baskets to score the most points. In the final station, students learned about sampling and sampling distributions by exploring the colors of beads sampled from a bulk box of colorful beads. When finished, students had the option of turning their beads into friendship bracelets.
 |
 |
